Platform
Trading Platforms
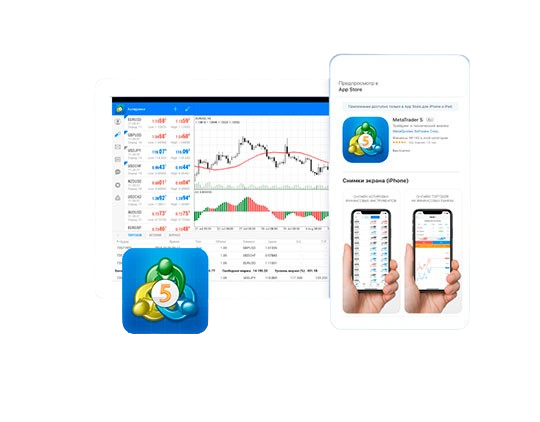
MT5 Android App
Navigate the financial waves with MT5’s premier trading app, designed to put the power of the markets in your palm.
MT5 IOS App
Navigate the financial waves with MT5’s premier trading app, designed to put the power of the markets in your palm.
MT5 Windows app
Navigate the financial waves with MT5’s premier trading app, designed to put the power of the markets in your palm.
MT5 Windows app
Navigate the financial waves with MT5’s premier trading app, designed to put the power of the markets in your palm.
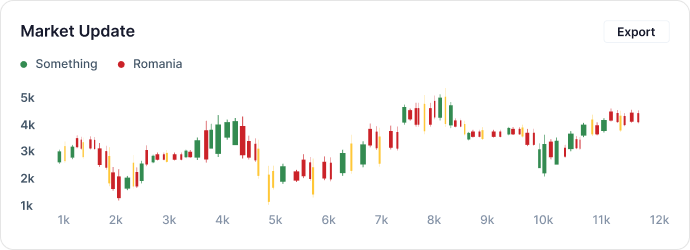
What is Trading
Financial Markets
The financial market refers to any marketplace where buyers and sellers engage in the trade of assets such as stocks, bonds, commodities, currencies, and derivatives. These markets play a crucial role in the economy by helping allocate resources, facilitate capital formation, and manage risk. Here are some key types of financial markets:
1. **Stock Markets**
2. **Bond Markets**
3. **Commodity Markets**
4. **Currency Markets (Forex)**
5. **Derivatives Markets**
6. **Money Markets**
What is Forex
The Forex market (short for Foreign Exchange market) is the global marketplace where currencies are traded. It is the largest and most liquid financial market in the world, with a daily trading volume exceeding $6 trillion. Unlike other financial markets, the Forex market is decentralized, meaning there is no central exchange or physical location where currencies are traded. Instead, trading happens electronically over-the-counter (OTC) through a network of banks, brokers, financial institutions, and individual traders.
Key Characteristics of the Forex Market: Currency Pairs: In Forex, currencies are traded in pairs. A currency pair consists of two currencies:
Base currency: The first currency in the pair, which you are buying or selling. Quote currency: The second currency in the pair, representing how much of the quote currency is needed to buy one unit of the base currency. Example: In the pair EUR/USD:
EUR (Euro) is the base currency. USD (U.S. Dollar) is the quote currency. If the exchange rate is 1.20, it means that 1 euro is equal to 1.20 U.S. dollars. 24-Hour Trading: The Forex market operates 24 hours a day, five days a week, making it different from stock markets that have fixed trading hours. This continuous trading is possible because the market spans multiple time zones across major financial centers worldwide, such as London, New York, Tokyo, and Sydney.
Tools Overview
These are tools used to analyze past price data and predict future price movements based on statistical analysis. Some of the most popular indicators include:
Moving Averages (MA): Used to smooth out price data over a set period and identify trends. Simple Moving Average (SMA) Exponential Moving Average (EMA) Relative Strength Index (RSI): Measures the magnitude of recent price changes to evaluate overbought or oversold conditions. Moving Average Convergence Divergence (MACD): A trend-following momentum indicator that shows the relationship between two moving averages. Bollinger Bands: Used to measure market volatility and identify overbought or oversold conditions. Stochastic Oscillator: A momentum indicator that compares a currency's closing price to its price range over a specific period. Fibonacci Retracements: Used to identify potential levels of support and resistance based on Fibonacci ratios. Parabolic SAR: Indicates potential reversals in the market.
Platform Comparison
Not sure which is the right FOREX platform for you? Check out our handy platform comparison table which will show you all the differences.
Check out our handy platform comparison table which will show you all the differences.
Download Trading App
We use cookines to understand how you use our website and to give you the best possible experience.
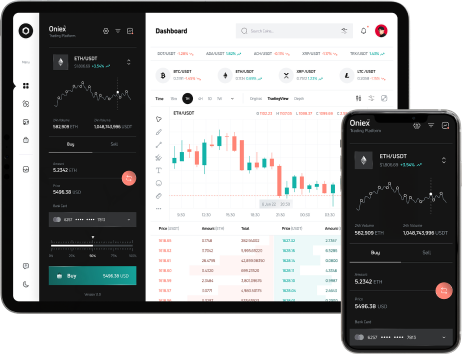
Level up your trading with Account
Not sure which is the right FOREX com platform for you? Check out our handy platform comparison table which will show you all the differences.
- Trade with one tap, anywhere, anytime
- Seamlessly manage your account and portfolio
- Stay ahead with real-time charts and indicators
Starter Account
Traders with Starter accounts gain access to a wide range of benefits, including enhanced trading platforms
Pro Account
Trading Pro accounts are particularly valuable for novice traders who are new to the world of investing.
Standarad Account
The primary feature of a trading overview account is its ability to aggregate information from multiple accounts and
HNI Account
HNI Account also adhere to ethical guidelines that prohibit trading certain financial instruments deemed